Track Circuit Monitoring Theory – how it works
- Provide enhanced algorithms to monitor integrity of track circuit indications and train progressions
- Categorize abnormal events in notifications, warning, and safety critical alerts
- Initiates Stop of train movements or appropriate Speed restrictions to prevent collisions. [QUOTE from NTSB R-09-7]
- Enabling long-term perspective for improved asset management
- Improve Track Circuit reliability and transportation safety
TCM reports the outcome of the track circuit evaluation in Track Occupancy Charts on a continued basis in real-time. Track Occupancy Charts are a form of Time-Distance Charts and are constructed as follows:
Figure 1 on the right illustrates a typical track alignment chart. It shows the track alignment on the x-axis (on top).
Within the grid underneath the alignment axis from A to B (here TC-1 to TC-5) occupancies are shown in light green shaded areas respective to the individual track circuits and their status (occupied or vacant) over time. See Figure 2 for the illustration of a train progression between location A and B.
Note: Clicking on any of the figures opens the image gallery of all track charts in enlarged view.
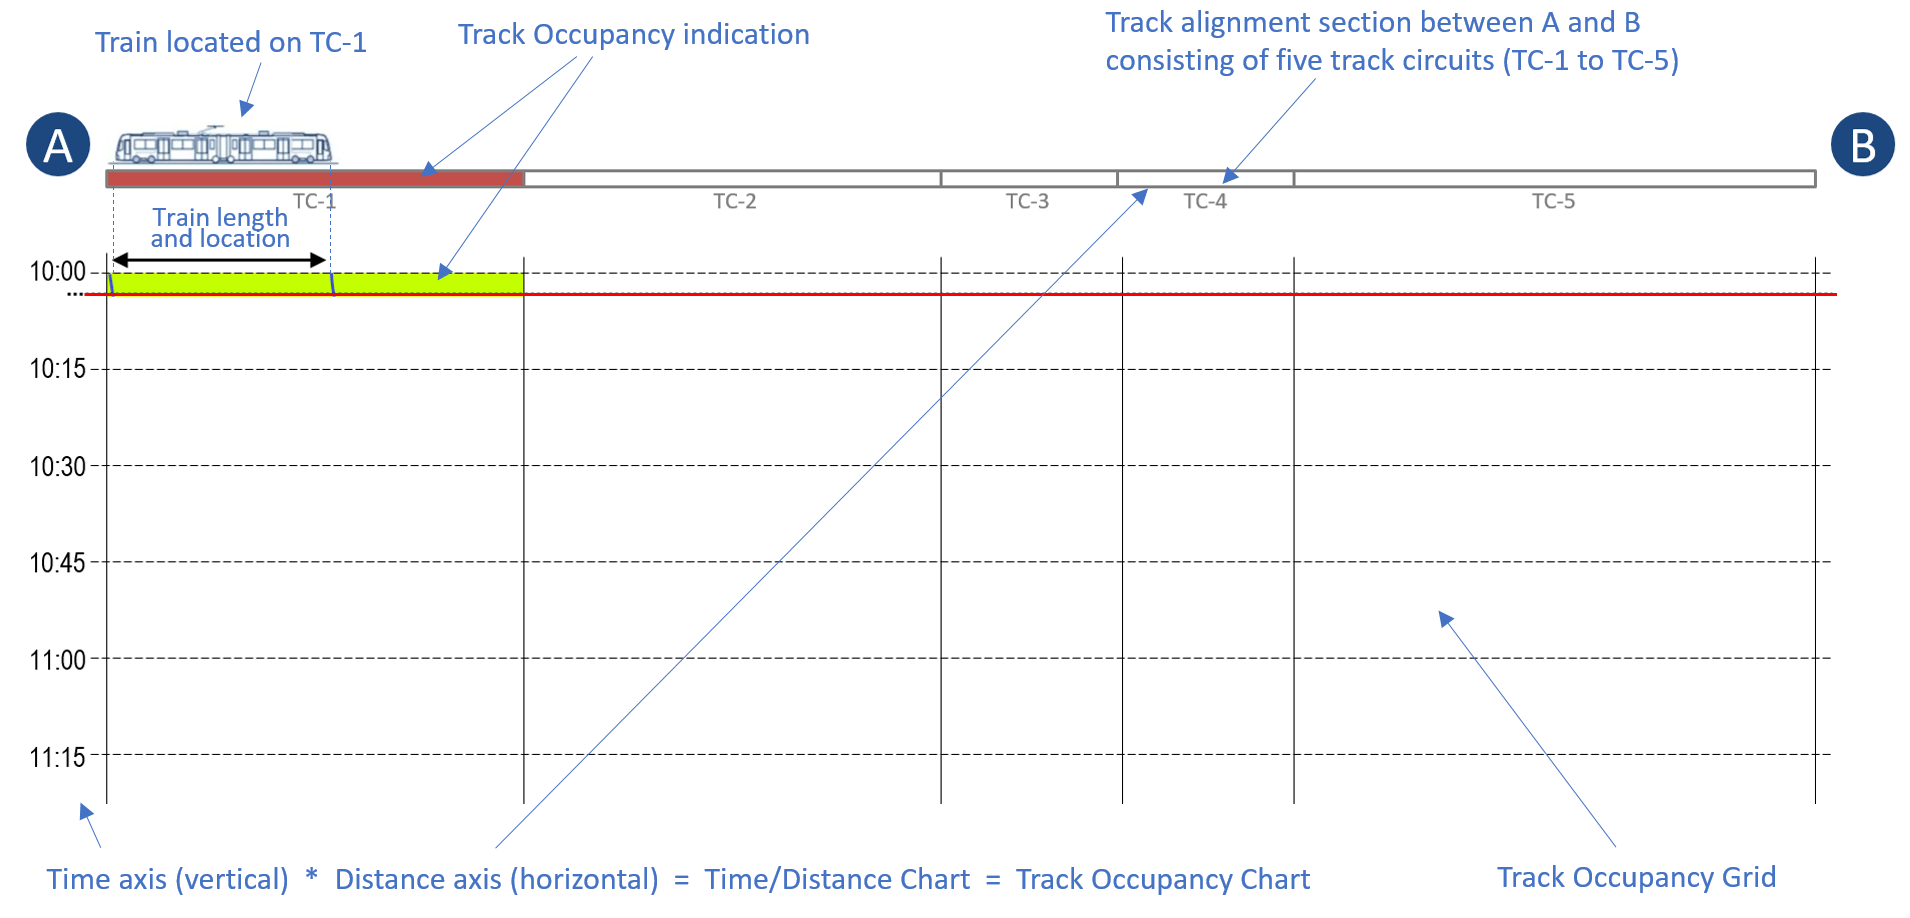
Figure 1: Train departing from location A at 10:00
Figure 2 furthermore shows Train fit lines (in mathematical jargon called Strict-fit lines). These lines are calculated by TCM, based on a number of track geometric parameters, track circuit parameters (incl. sequence), and train specific parameters. The two fit lines show the most-likely progression of the train over time. The distance between these two lines correspond to the length of the train – the right line representing the head-end of the train and the left line representing the tail-end.
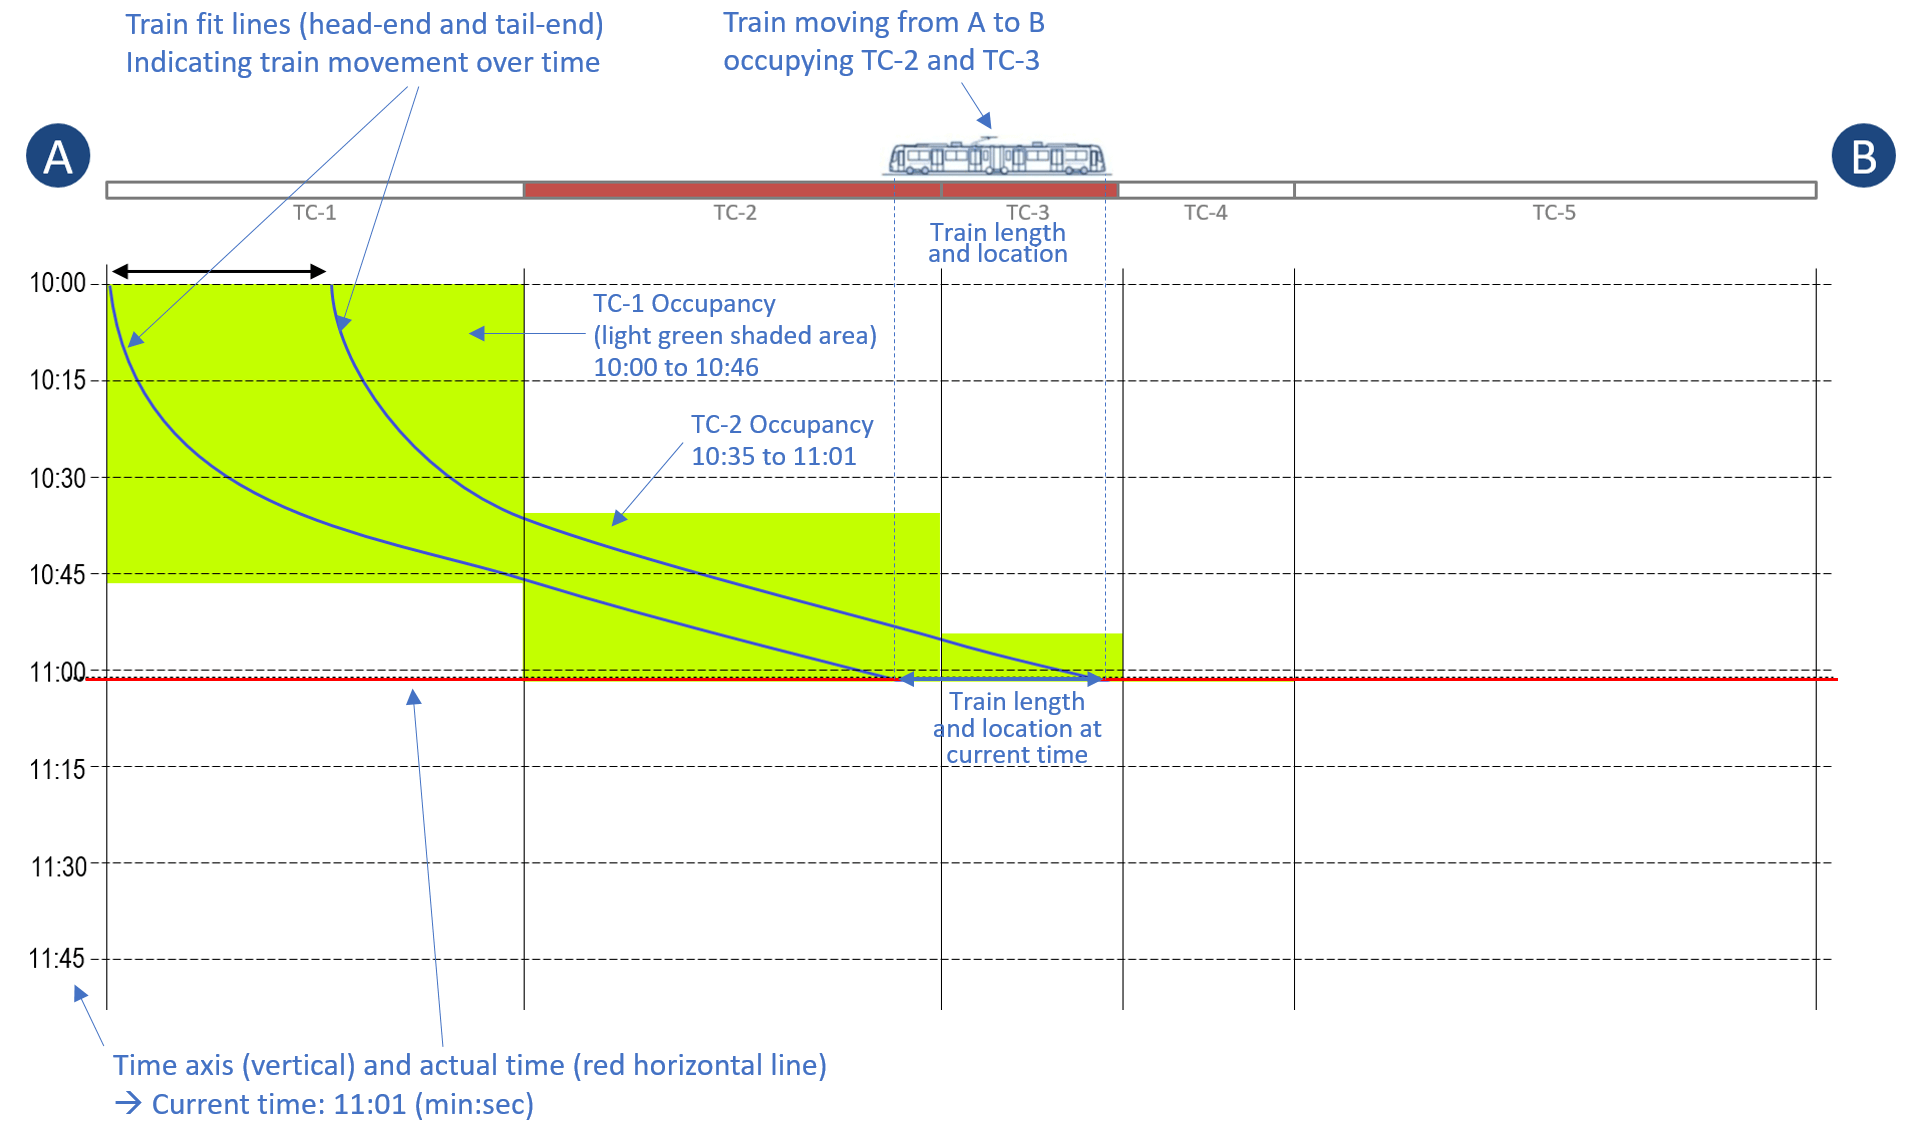
Figure 2: Train in transit between location A and location B at constant speed (current time 11:01)
Figure 3 shows the Train as it arrives at location B. The angle of the tangent line is a measure of train speed. If the tangent line of the train fit curve is vertical, it represents a non-moving train (speed = zero). Conversely, a horizontal line represents a train that goes at the speed of light.
This type of chart is also known as time distance chart. The green shaded areas show track circuit occupancies over time, meaning from the moment the first axle of the train touches the track circuit until the last axle of the train leaves the track circuit.
A train movement from location B to A would look similar, but occupancies and train fit lines would be in direction from top/right to bottom/left.
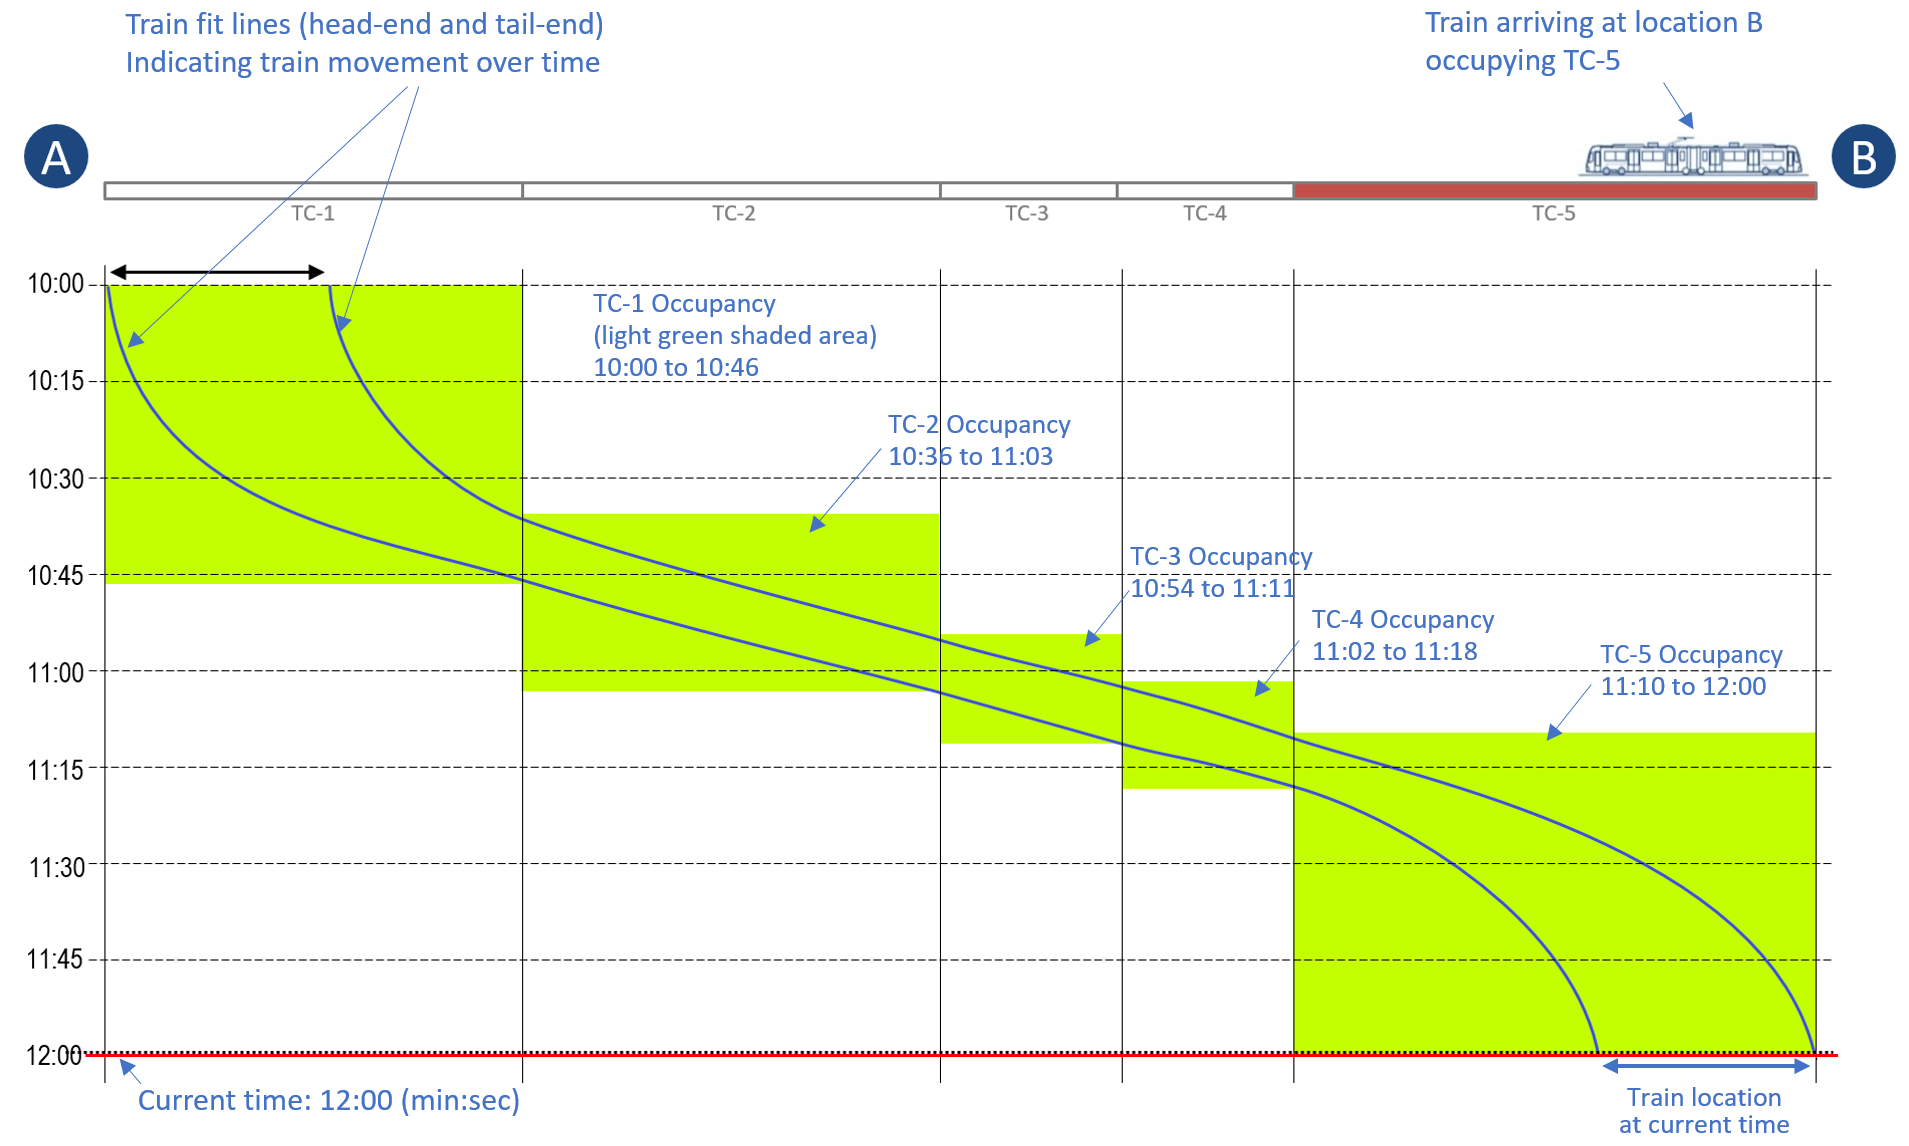
Figure 3: Train arriving at location B at 12:00
Figure 4 illustrates the most important information in track occupancy charts: Track circuit anomalies are highlighted by a solid colored circle (called trouble dots) with a numeric number next to it in ft*sec. This number quantifies the severity of a track circuit failure.
A severity of 1000 and higher is considered safety critical and requires immediate attention by operations and maintenance. Lower severities are shown in orange or green (<100).
Figure 4 shown a serious track circuit malfunction that results in the disappearance of the train from the vital train control logic for 5 seconds (6:56:55 – 6:57:00). The affected track circuit B06-B2-304 reported a false indication (i.e. LOS) for even 15 seconds (6:56:47 – 6:57:02), preceded by a series of false occupancies (i.e. bobbing track circuits). This condition can result in serious consequences such as train collision with a following or opposing train.
TCM reports this condition in real-time as a critical alarm within seconds of its occurrence.
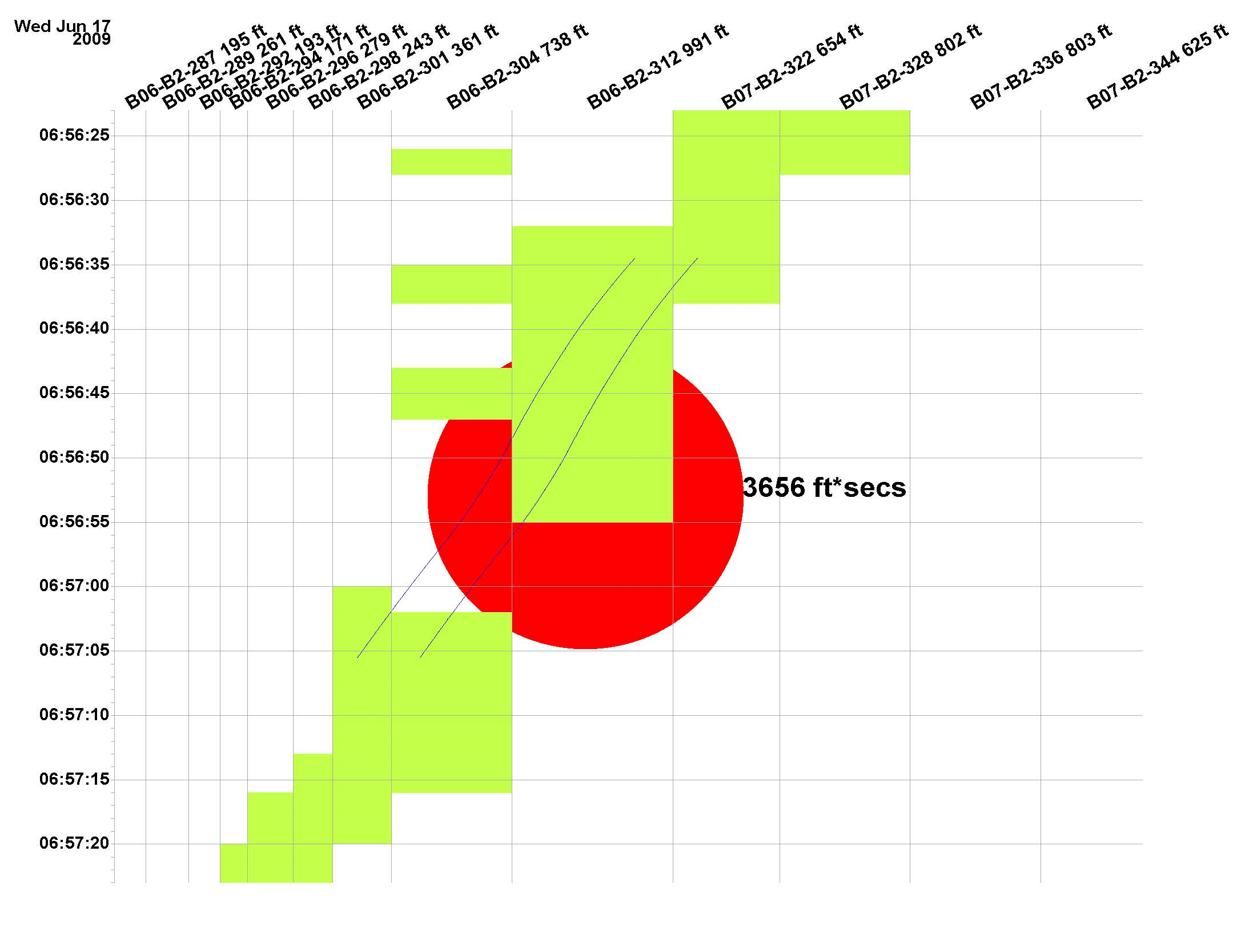
Figure 4: Loss Of Shunt condition ( TC B06-B2-304)