TCM typical Track Graphs and Reports
The table below represents a selection of TCM images. The table is divided into Track Charts and TCM Tool snapshots. Click on the image icon in the right column to enlarge the image.
| Image No. | Description | Image thumbnail (click to open) |
|---|---|---|
| 1-1 | Typical rush hour Track Occupancy Chart and Train Fit Lines overlay (Northbound) | 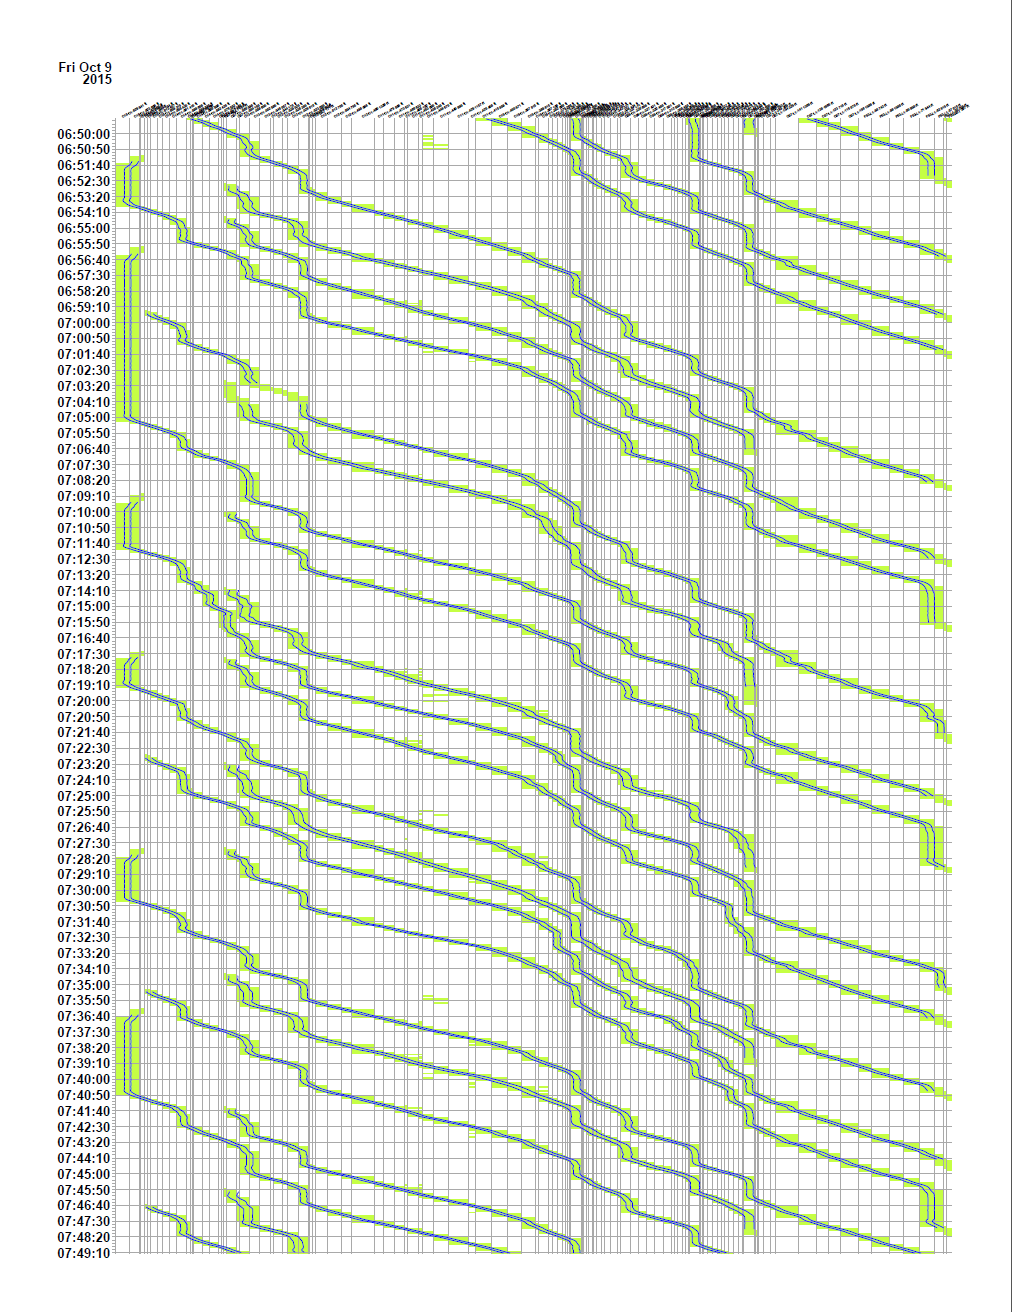 |
| 1-2 | Typical rush hour Track Occupancy Chart and Train Fit Lines overlay (Southbound) | 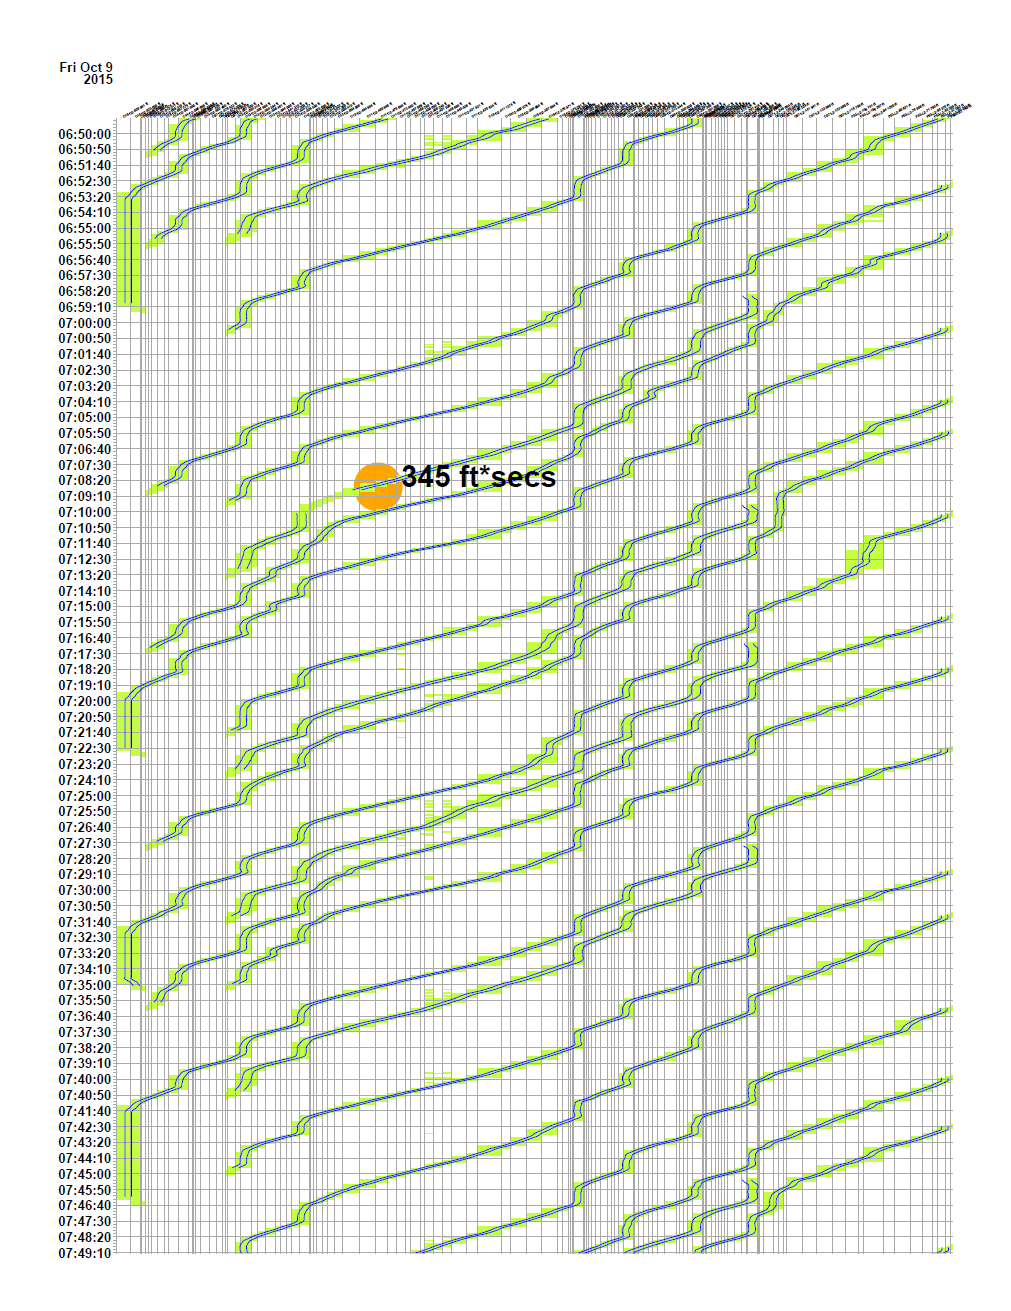 |
| 1-3 | Track Chart – Speed Approximation | 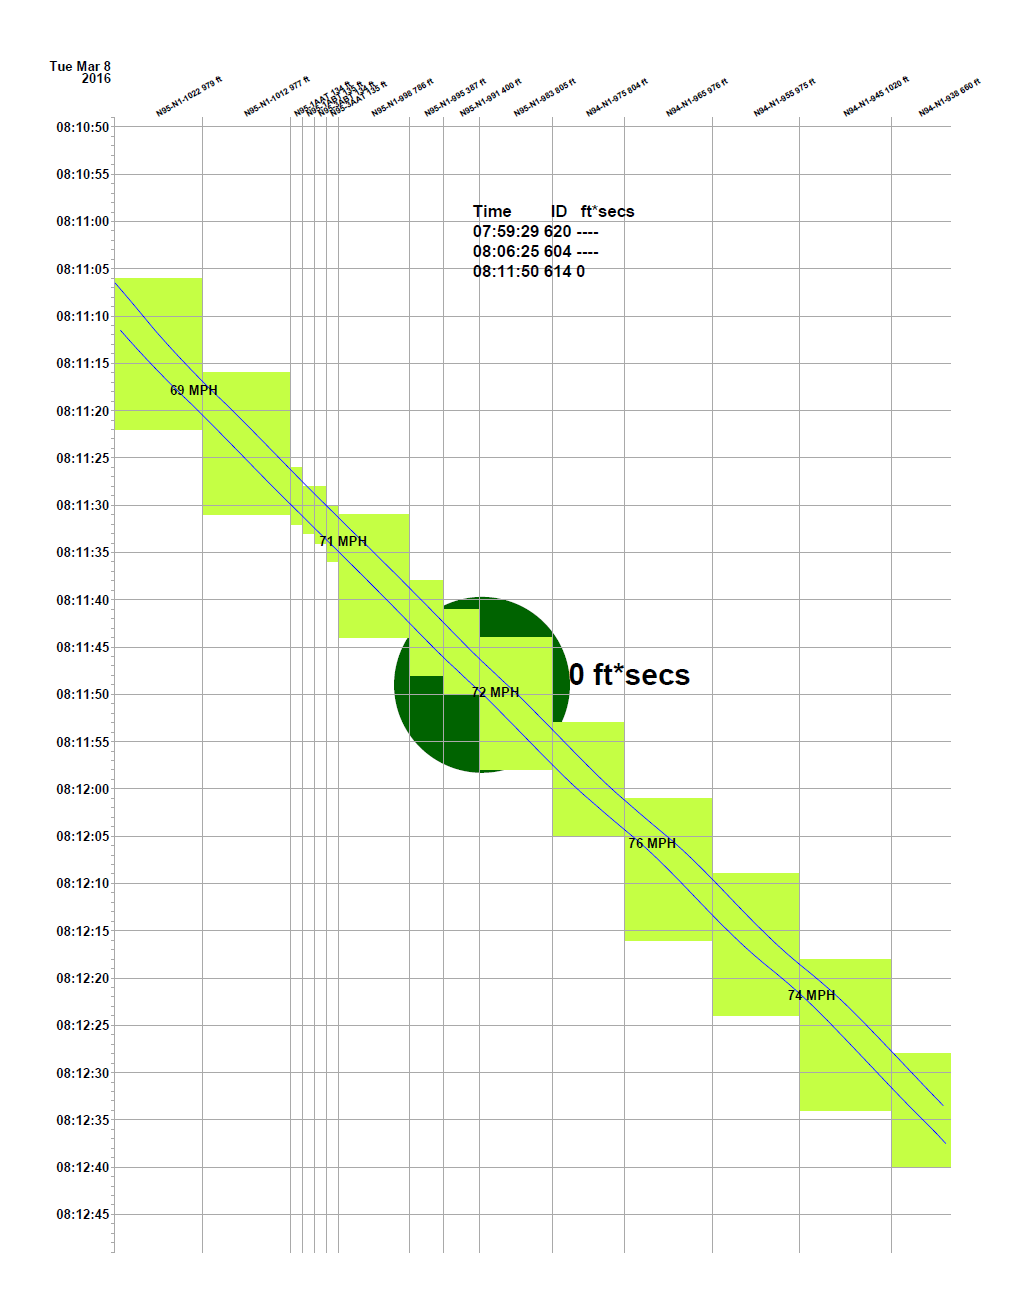 |
| 1-4 | Track Chart – LOS from Rusty Rail due to snow melting Salt on Grade Crossing | 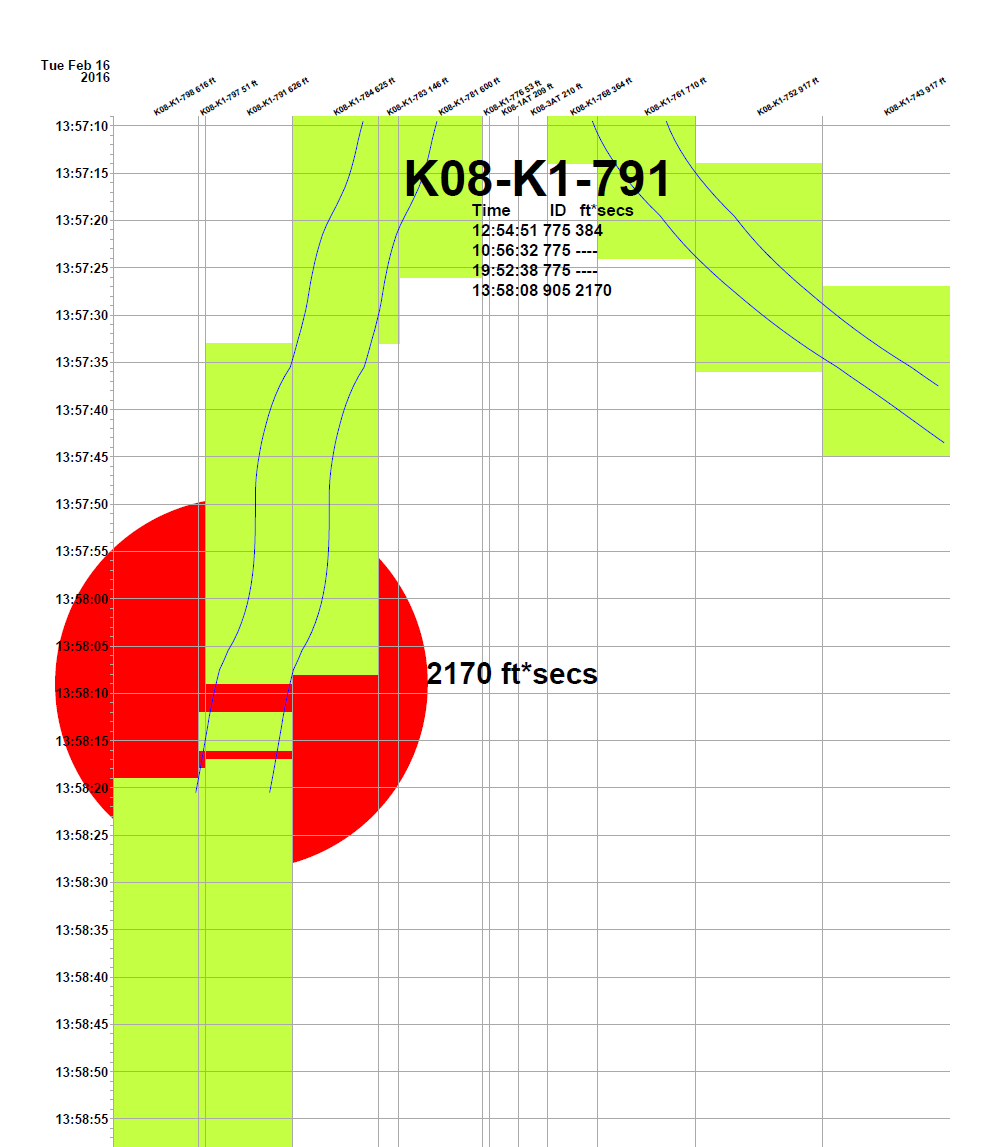 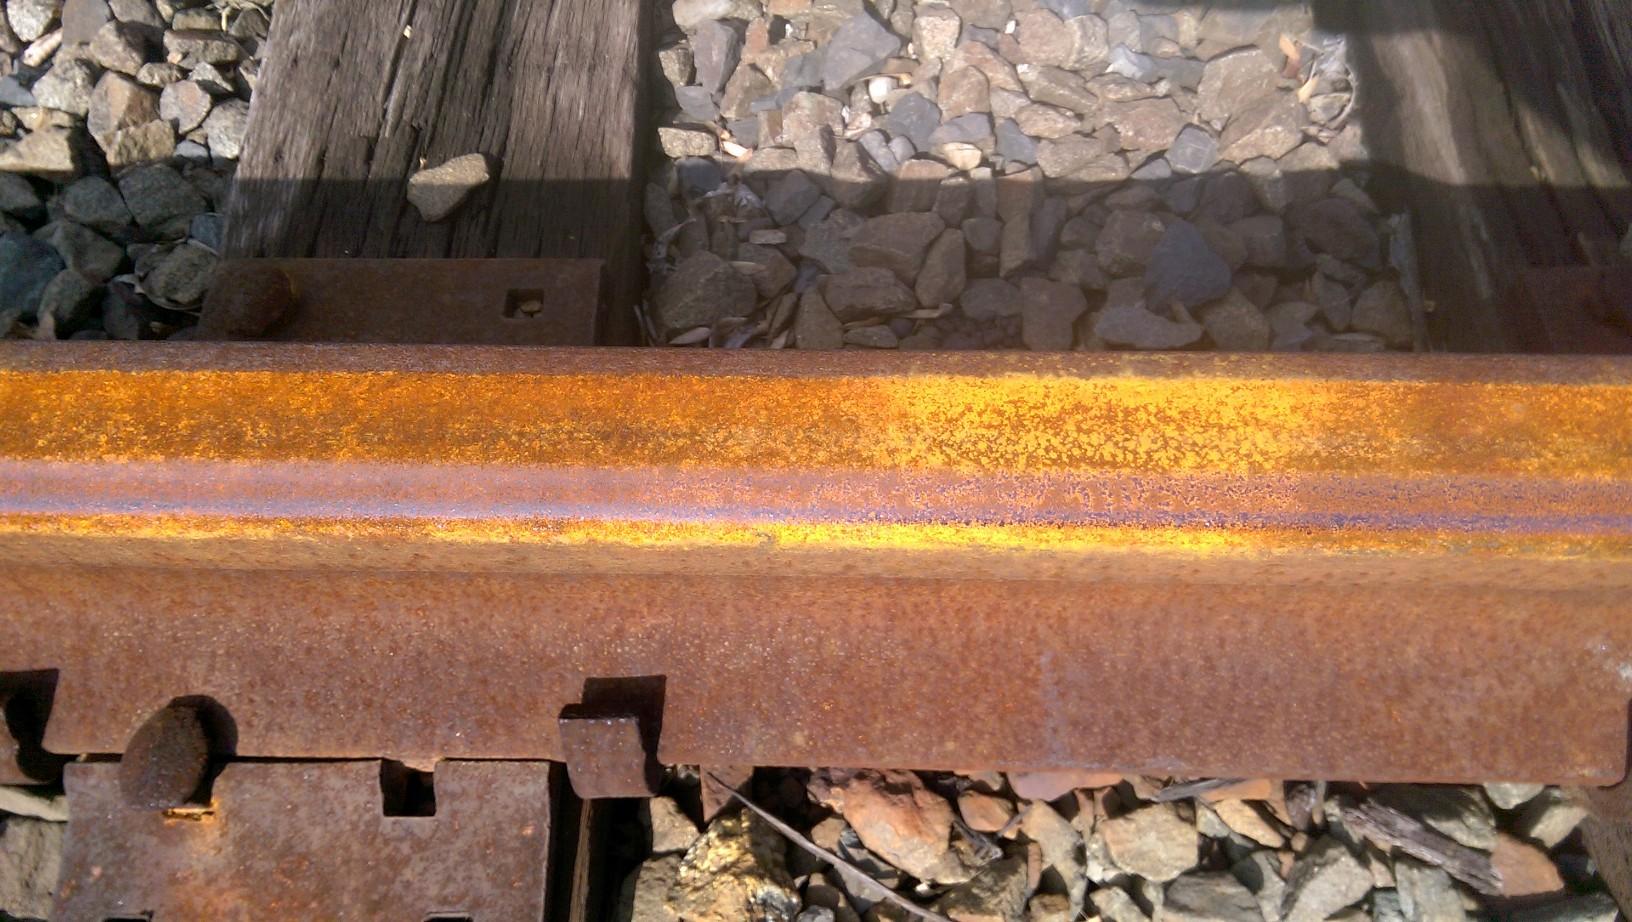 |
| 2-1 | TCM Tool Alert – Broken Rail (full screen) | 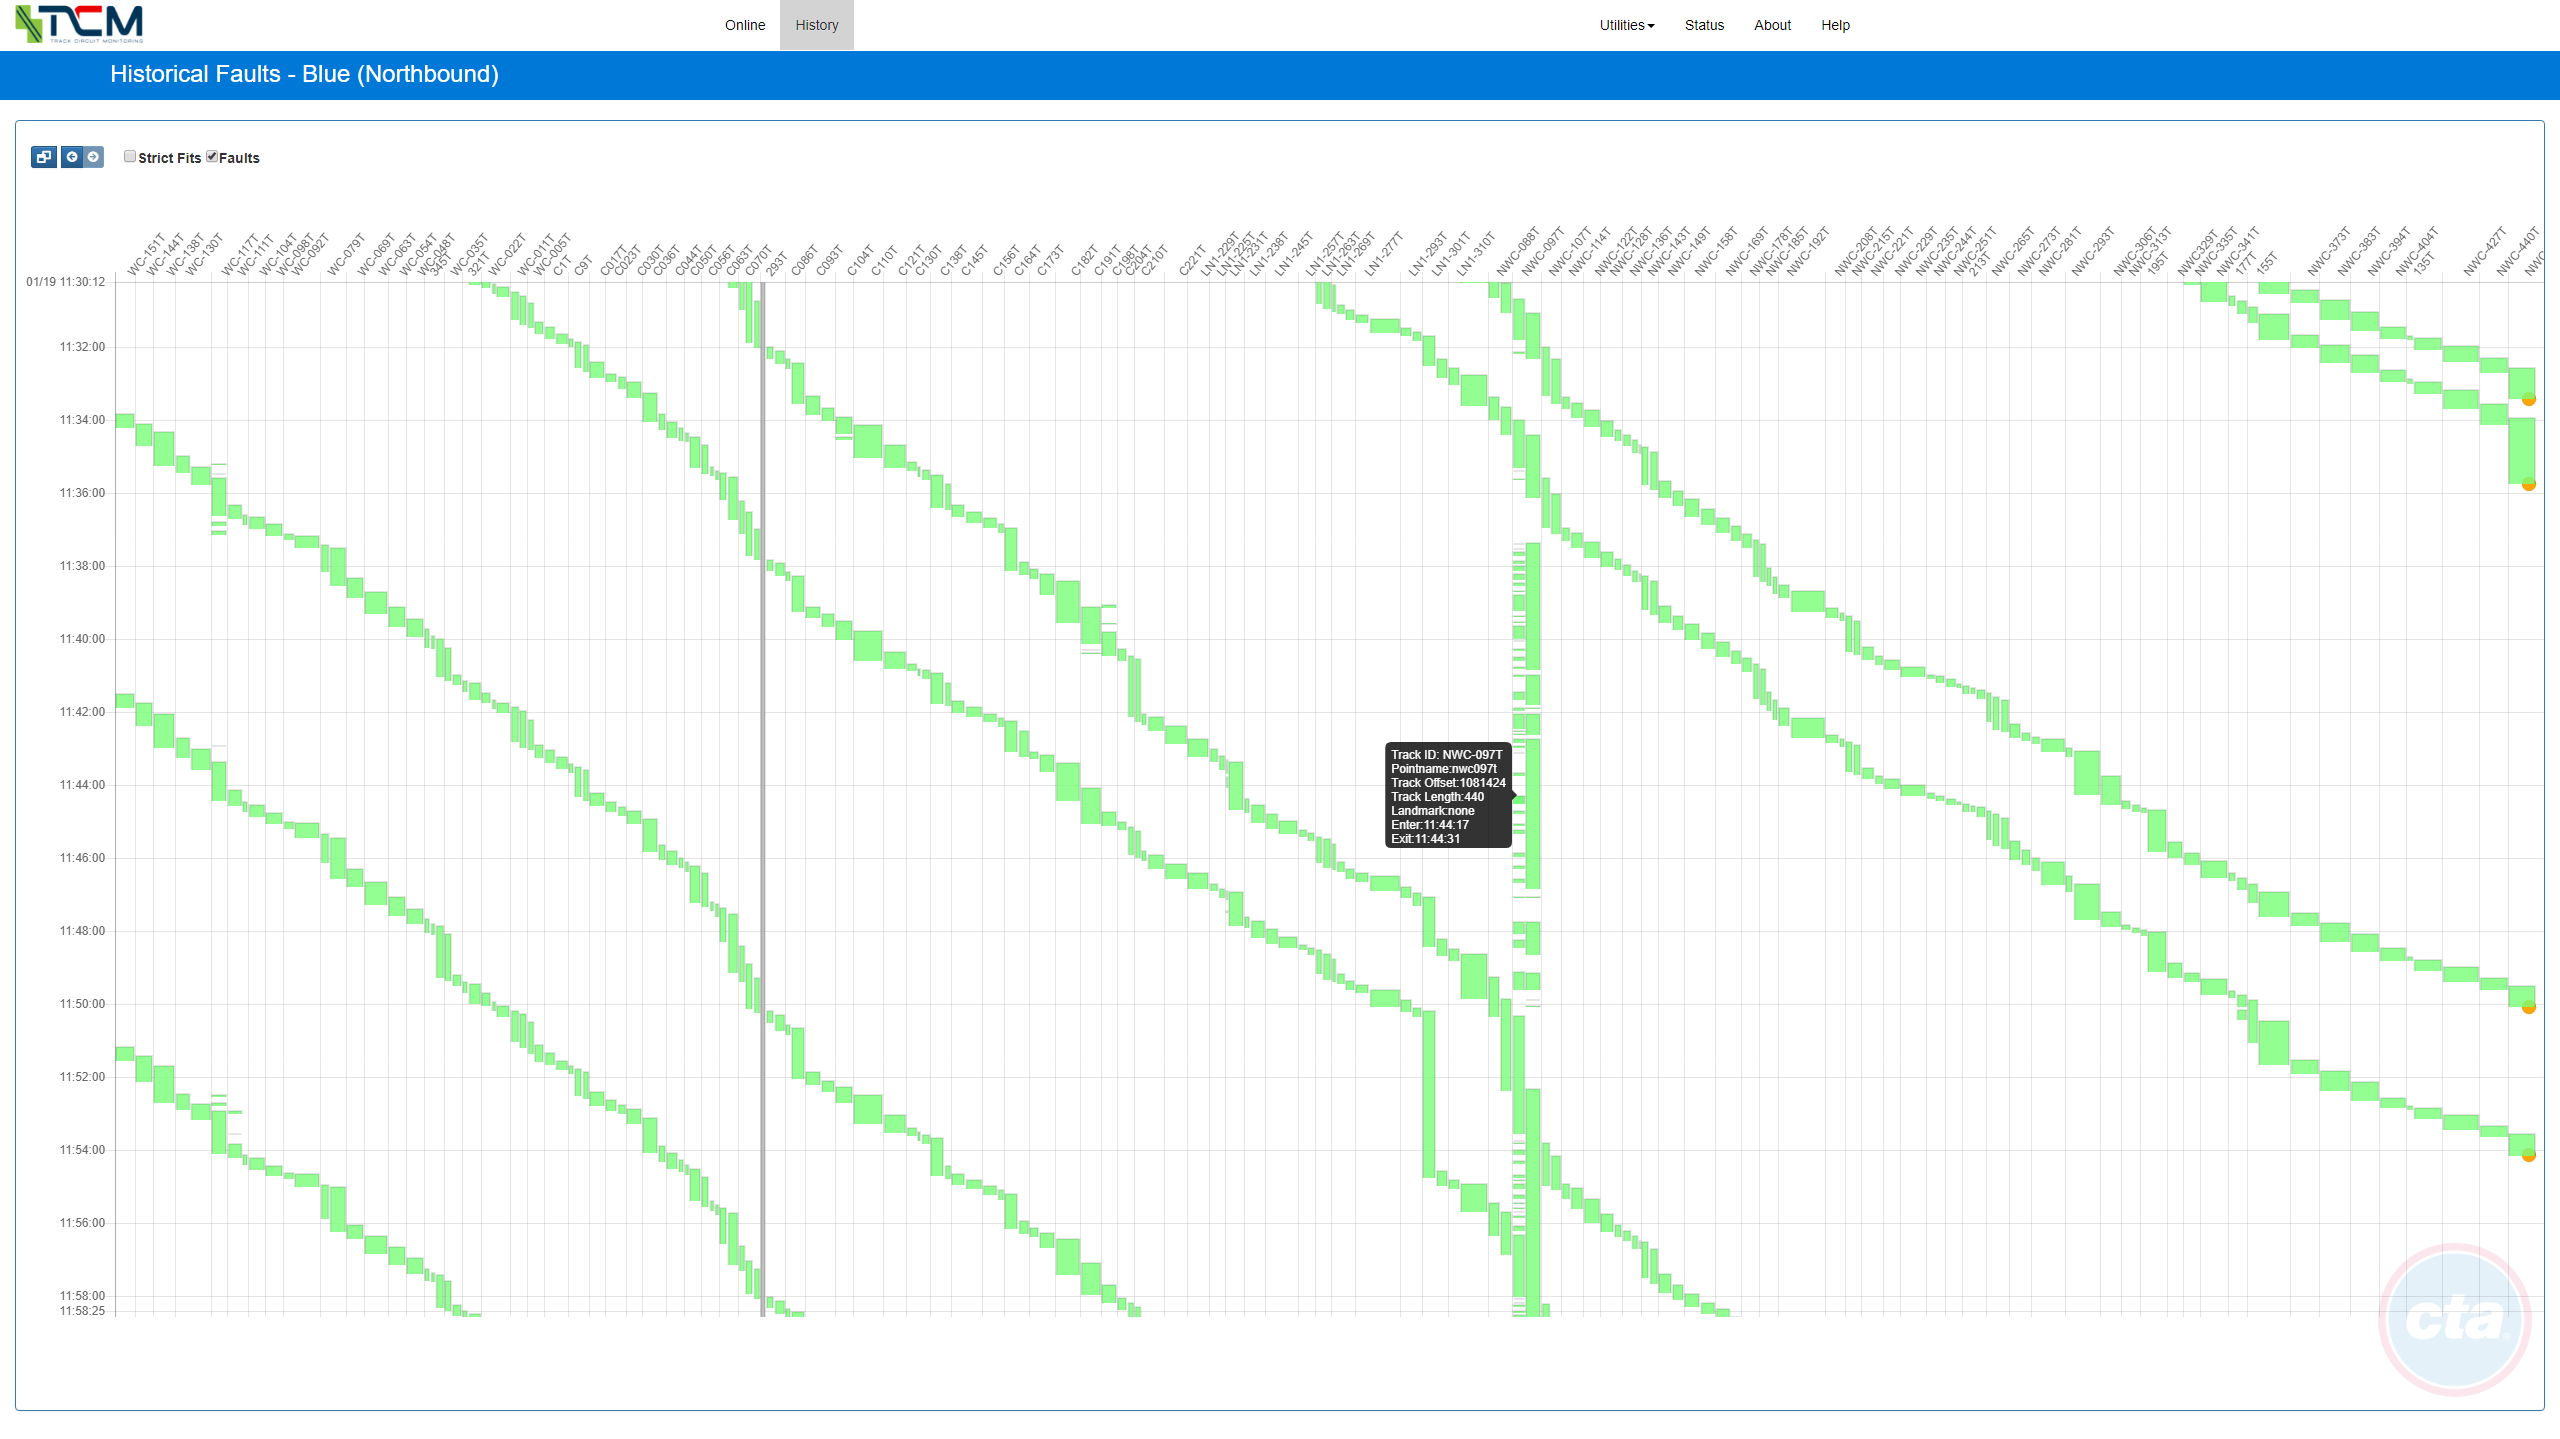 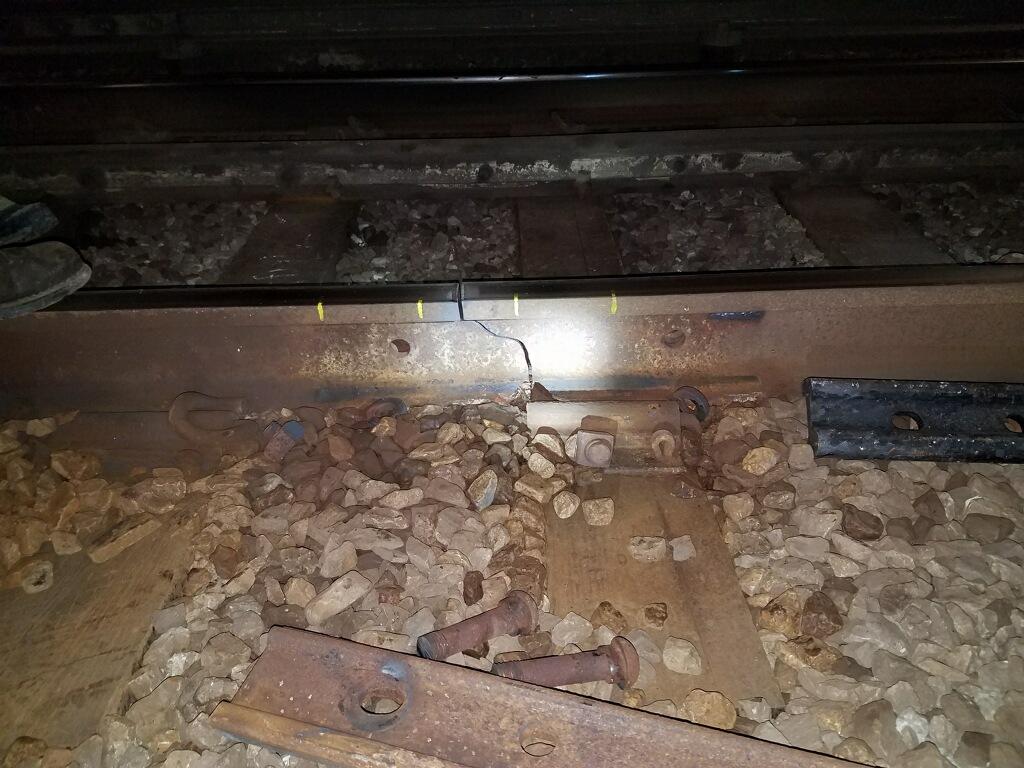 |
| 2-2 | TCM Tool – PDF Viewer | 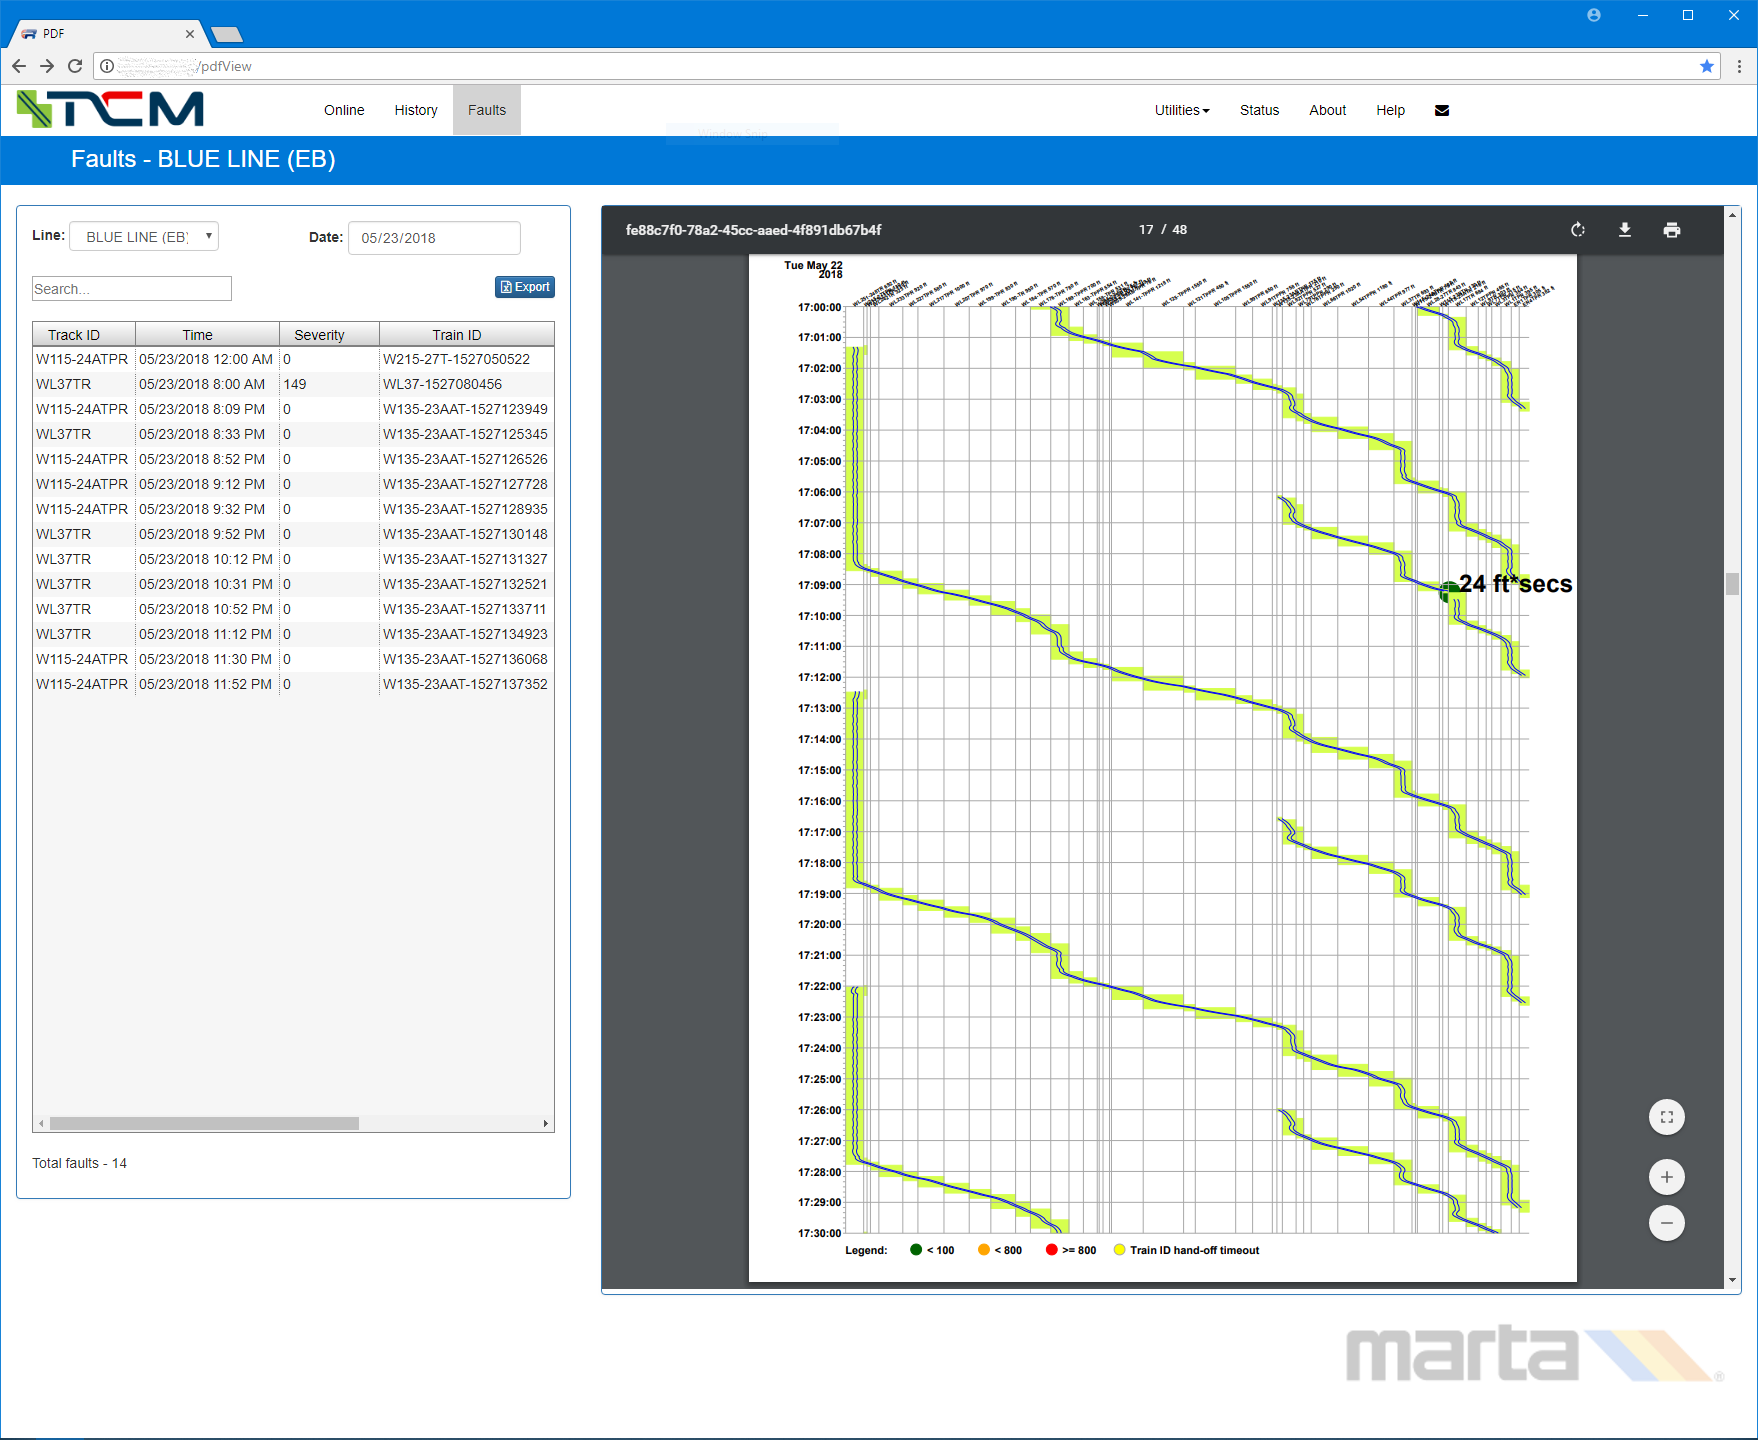 |
| 2-3 | TCM Tool – Fault Analytics | 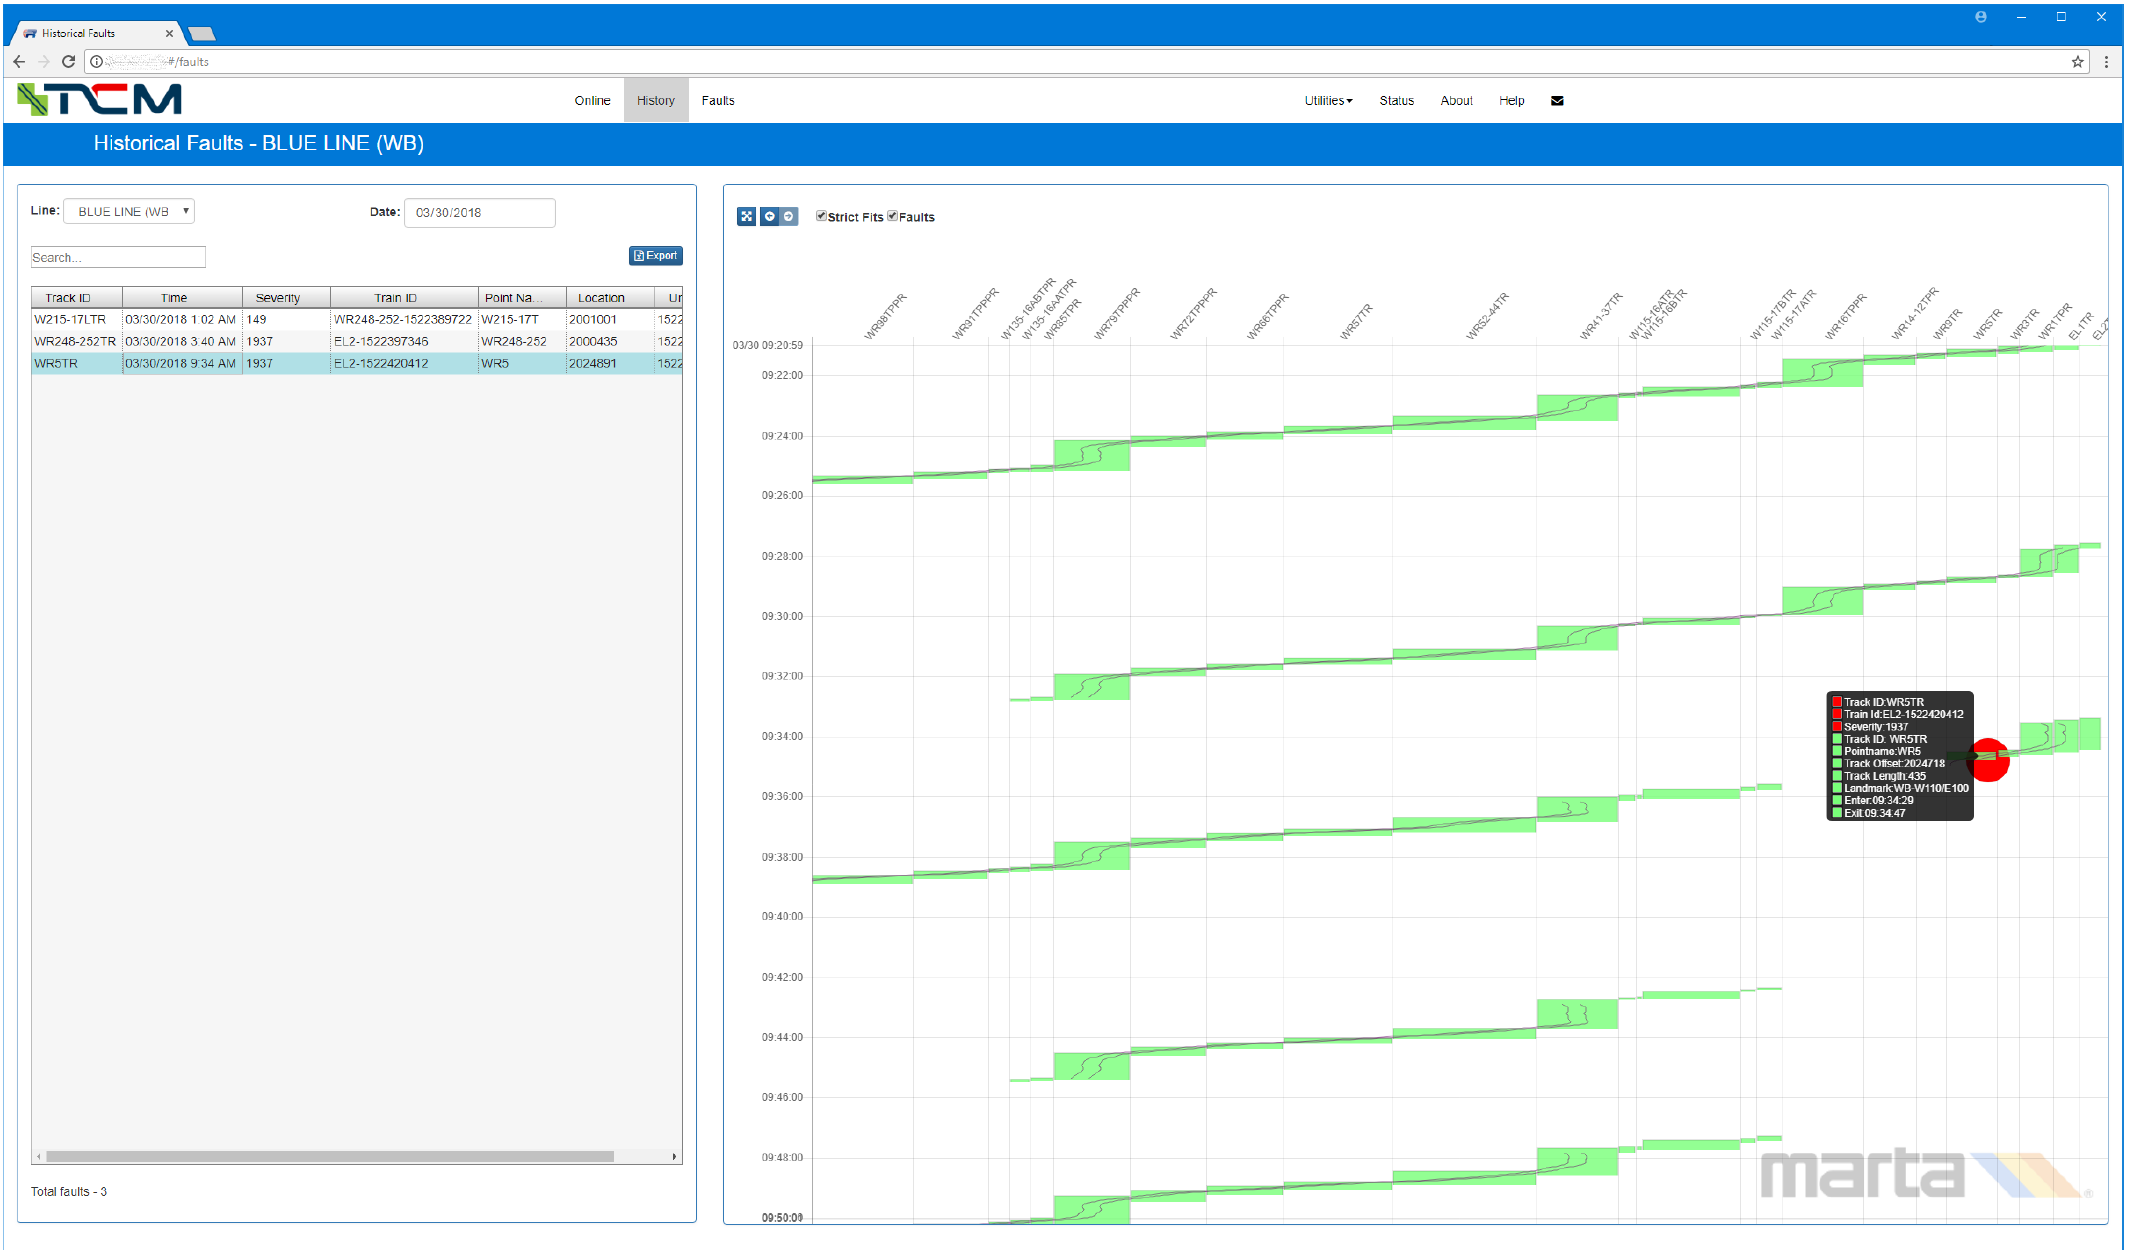 |
| 2-4 | TCM Tool – Live data streaming Viewer | 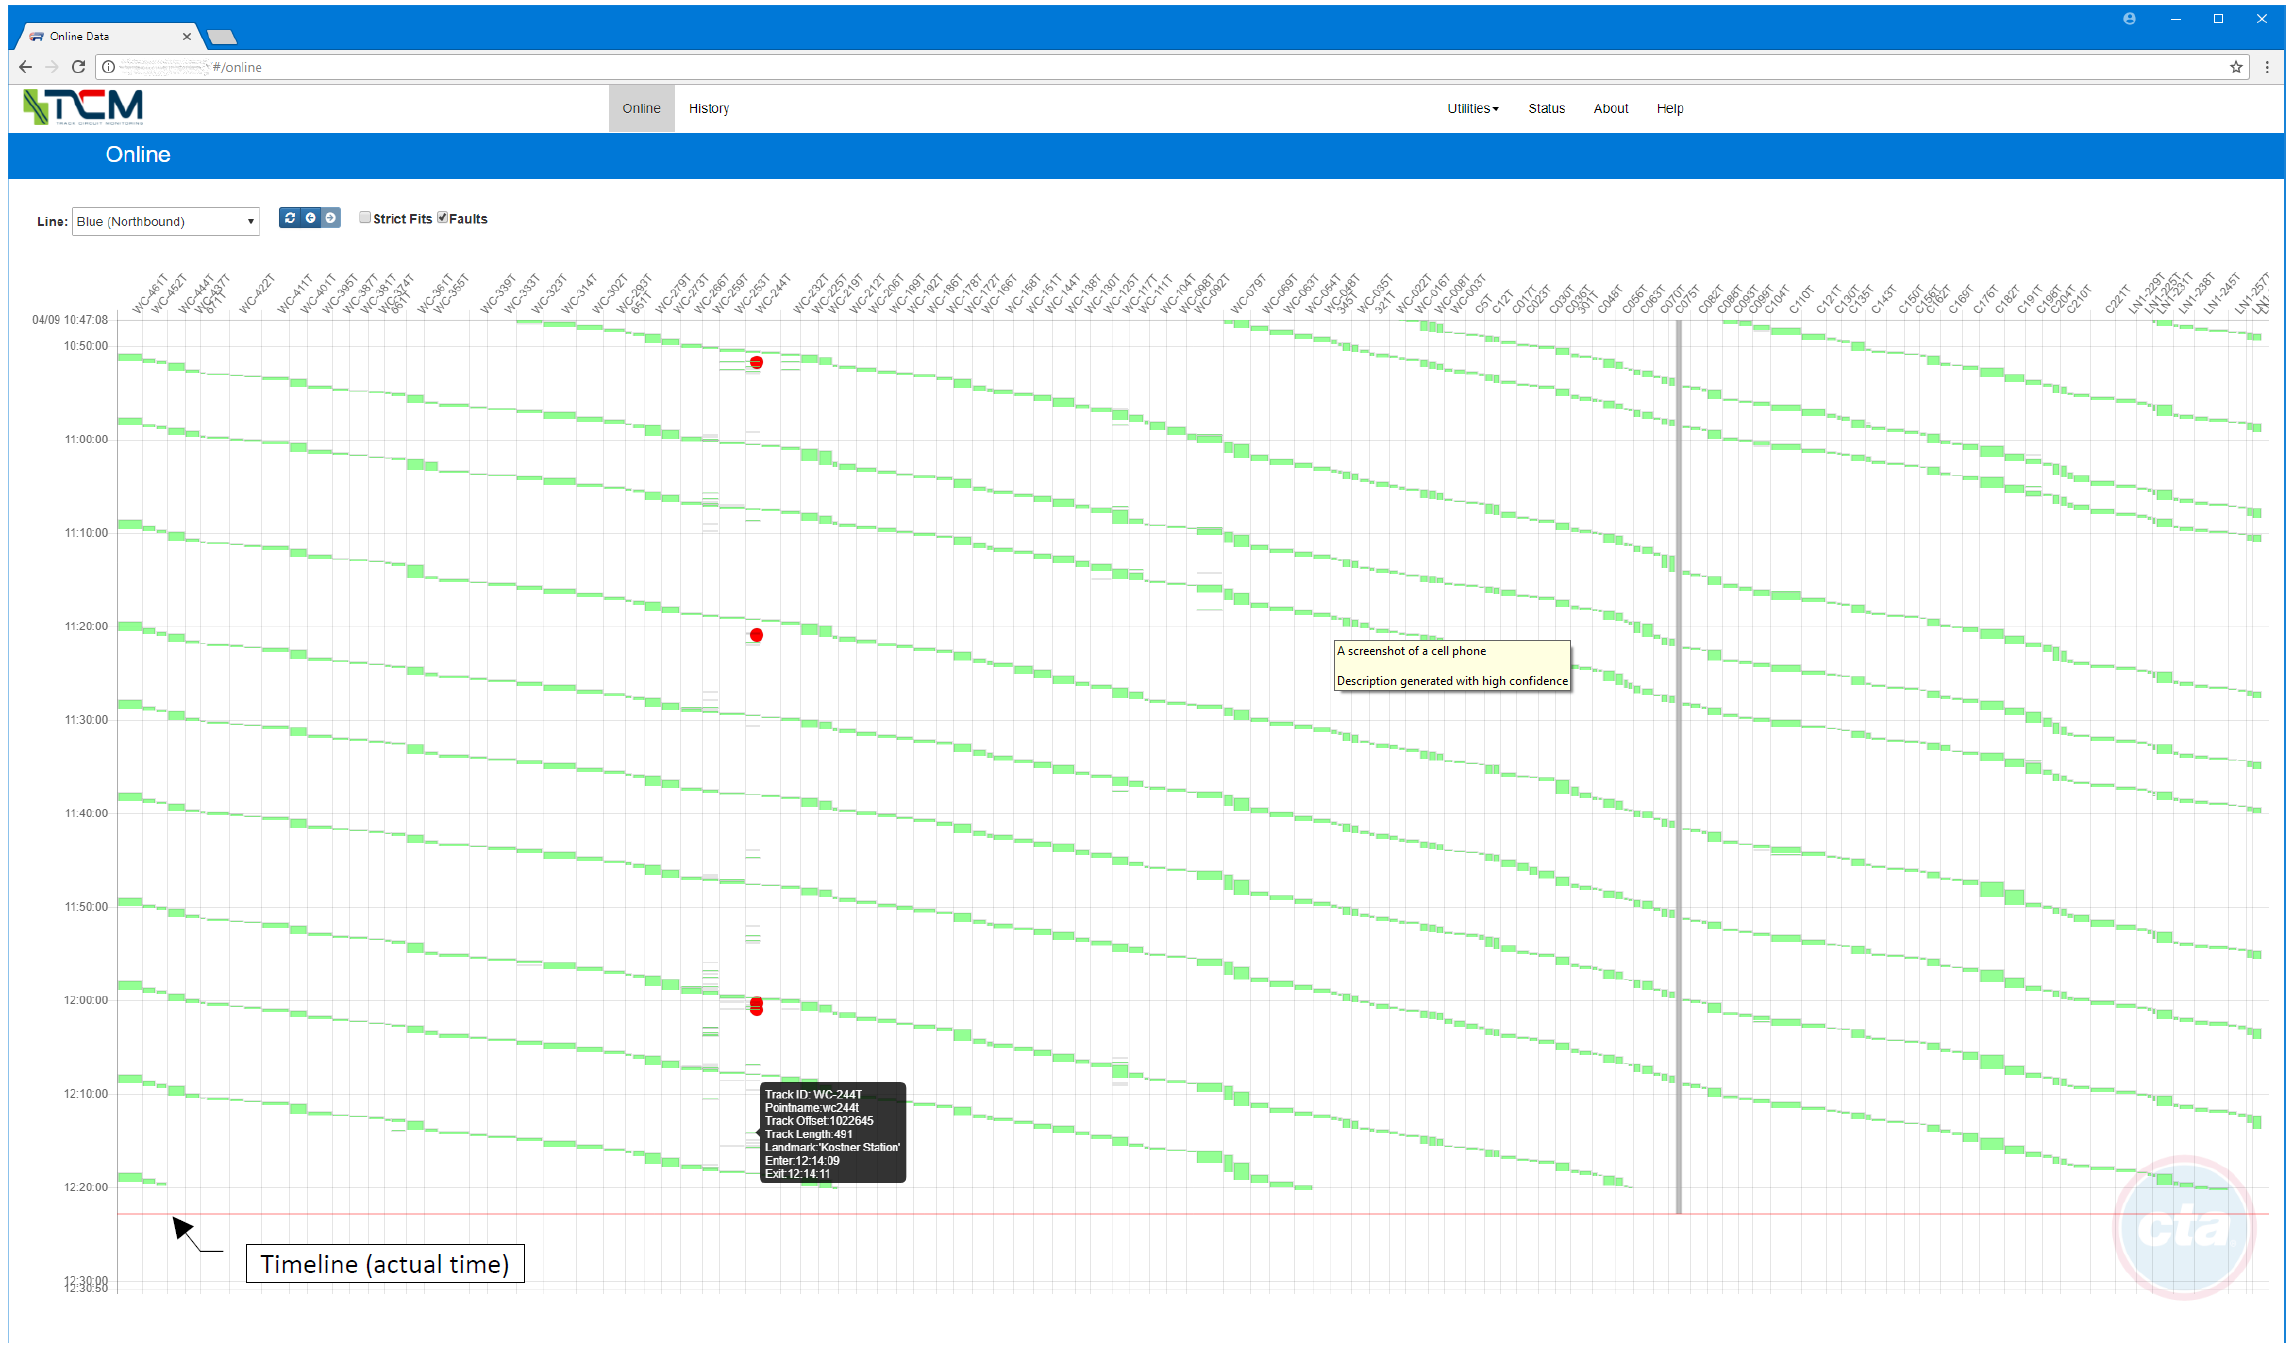 |
| 2-5-1 | TCM Tool – Reports Selection and Viewer (showing test data) |  |
| 2-5-2 | TCM Tool – Reports test data full screen |  |
| 2-5-3 | TCM Tool – Report export to pdf file (showing test data) |  |